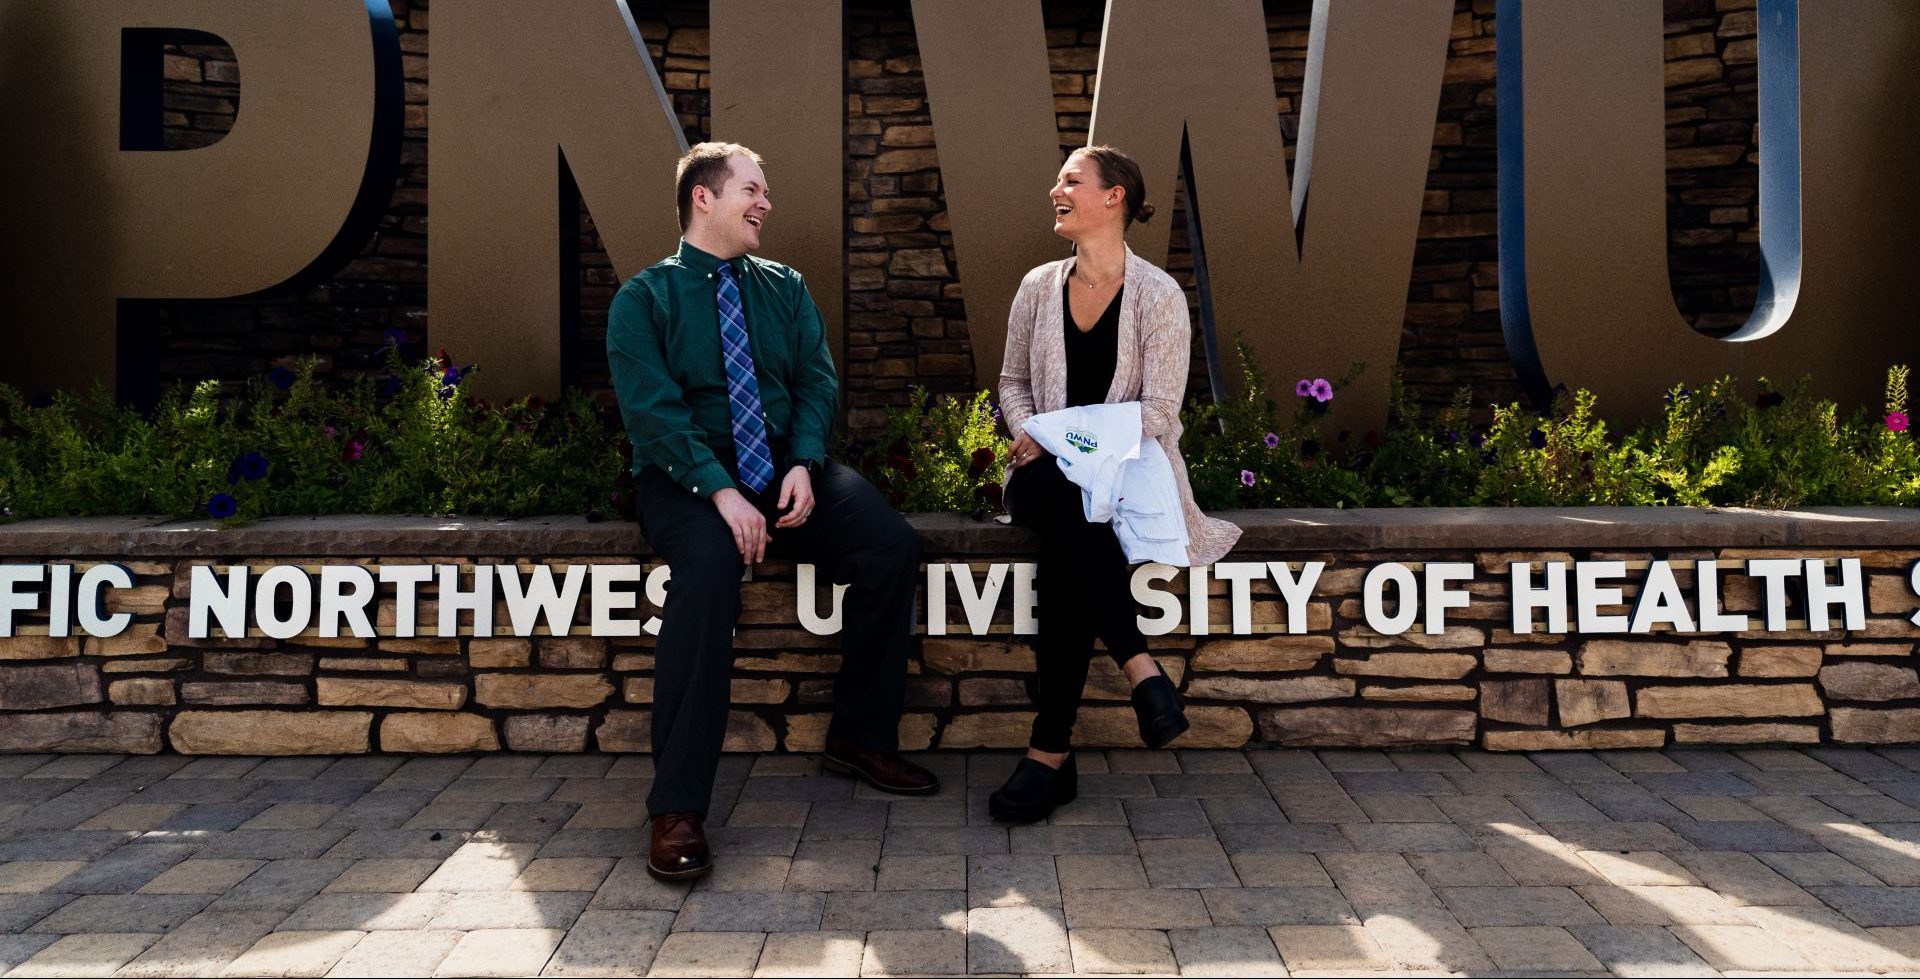
Pacific Northwest University of Health Sciences
Founded in 2005, Pacific Northwest University of Health Sciences (PNWU) opened its doors to the first cohort of students within the College of Osteopathic Medicine in 2008. Subsequently the first cohort of students within the Master of Arts in Medical Sciences program matriculated in 2021 and the first cohort of School of Physical Therapy students matriculated in 2022. PNWU is accredited by the Northwest Commission on Colleges and Universities (NWCCU). The PNWU mission is to educate and train health care professionals, emphasizing service in rural and underserved communities, primarily in the Northwest.
| 2023 | 2024 | 2025 | |
| Matriculants | 197 | 197 | 247 |
| Avg. Age | 25 | 26 | 27 |
| Age Range | 21-47 | 20-56 | 20-50 |
| % Female | 52.8% | 62.9% | 61.5% |
| % Male | 46.7% | 37.1% | 38.1% |
| % Undisclosed | 0.5% | – | 0.4% |
| % from the NW | 70% | 66% | 70% |
| Alaska | 2.0% | – | 1.6% |
| Idaho | 3.6% | 4.1% | 5.3% |
| Montana | 1.5% | 1.5% | 2.8% |
| Oregon | 8.6% | 7.6% | 6.5% |
| Washington | 54.3% | 53.3% | 54.3% |
| % from a Rural Area | 23% | 13% | 24% |
| % from a Medically Underserved Area (MUA) | 29% | 32% | 34% |
| White | 49.2% | 38.1% | 45.3% |
| Asian | 27.9% | 31.0% | 19.8% |
| Black or African American | 0.5% | 2.5% | 4.0% |
| American Indian or Alaska Native | – | – | 1.2% |
| Native Hawaiian or Other Pacific Islander | 0.5% | – | 1.2% |
| Two or More Races | 6.1% | 7.6% | 6.1% |
| Hispanic | 15.2% | 18.3% | 19.8% |
| Undeclared | 0.5% | 2.5% | 2.4% |
Fall Enrollment as of September 1st, 2025
| 2022 | 2023 | 2024 | 2025 |
| 622 | 650 | 665 | 690 |
Spring Enrollment as of January 17th, 2025
| 2023 | 2024 | 2025 |
| 623 | 658 | 669 |
Total Degrees Conferred
| Graduation Year | Number of Graduates |
|---|---|
| 2012 | 68 |
| 2013 | 74 |
| 2014 | 71 |
| 2015 | 71 |
| 2016 | 71 |
| 2017 | 133 |
| 2018 | 139 |
| 2019 | 135 |
| 2020 | 140 |
| 2021 | 137 |
| 2022 | 177 |
| 2023 | 159 |
| 2024 | 177 |
| 2025 | 200 |
| Total | 1,752 |
As part of our efforts to improve student success, including the identification and closure of equity gaps within our institution, PNWU compares disaggregated outcomes for key student indicators to the overall performance of regional and national peers.
| University or PNWU Disaggregation | Graduation within 100% of Program Length | Licensure Exam First Attempt Pass Rate |
| Pacific Northwest University of Health Sciences | 86.1% | 87.8% |
| Female | 87.7% | 82.4% |
| Male | 84.2% | 93.8% |
| Prior Pell Grants | 81.8% | 82.0% |
| Underrepresented Minority* | 83.3% | 85.7% |
| Regional Peer 1 | 83% | 89% |
| Regional Peer 2 | 81% | 88% |
| Regional Peer 3 | 85% | 85% |
| National Peer 1 | 83% | 94% |
| National Peer 2 | 84% | 92% |
| National Peer 3 | 81% | 93% |
*Underrepresented Minority includes any student who selected at least one of the following IPEDS reporting categories: American Indian or Alaska Native, Black or African American, Native Hawaiian or Other Pacific Islander, Hispanic or Latino.
Updated September 2025 with AY 2024-25 graduation and licensure exam results (COMLEX Level 2-CE in this reporting period) for PNWU programs and the most recently published graduation and licensure exam results (COMLEX Level 2-CE, Part II PAM, PANCE, and NAPLEX in this reporting period) for peer institutions.
